Investing Guides
Your Broker Says You're Up 20% — But What's Your Real Return?
A complete guide to measuring the return on your investments—without being fooled by deposits, dividends, fees or currency.

Key takeaways
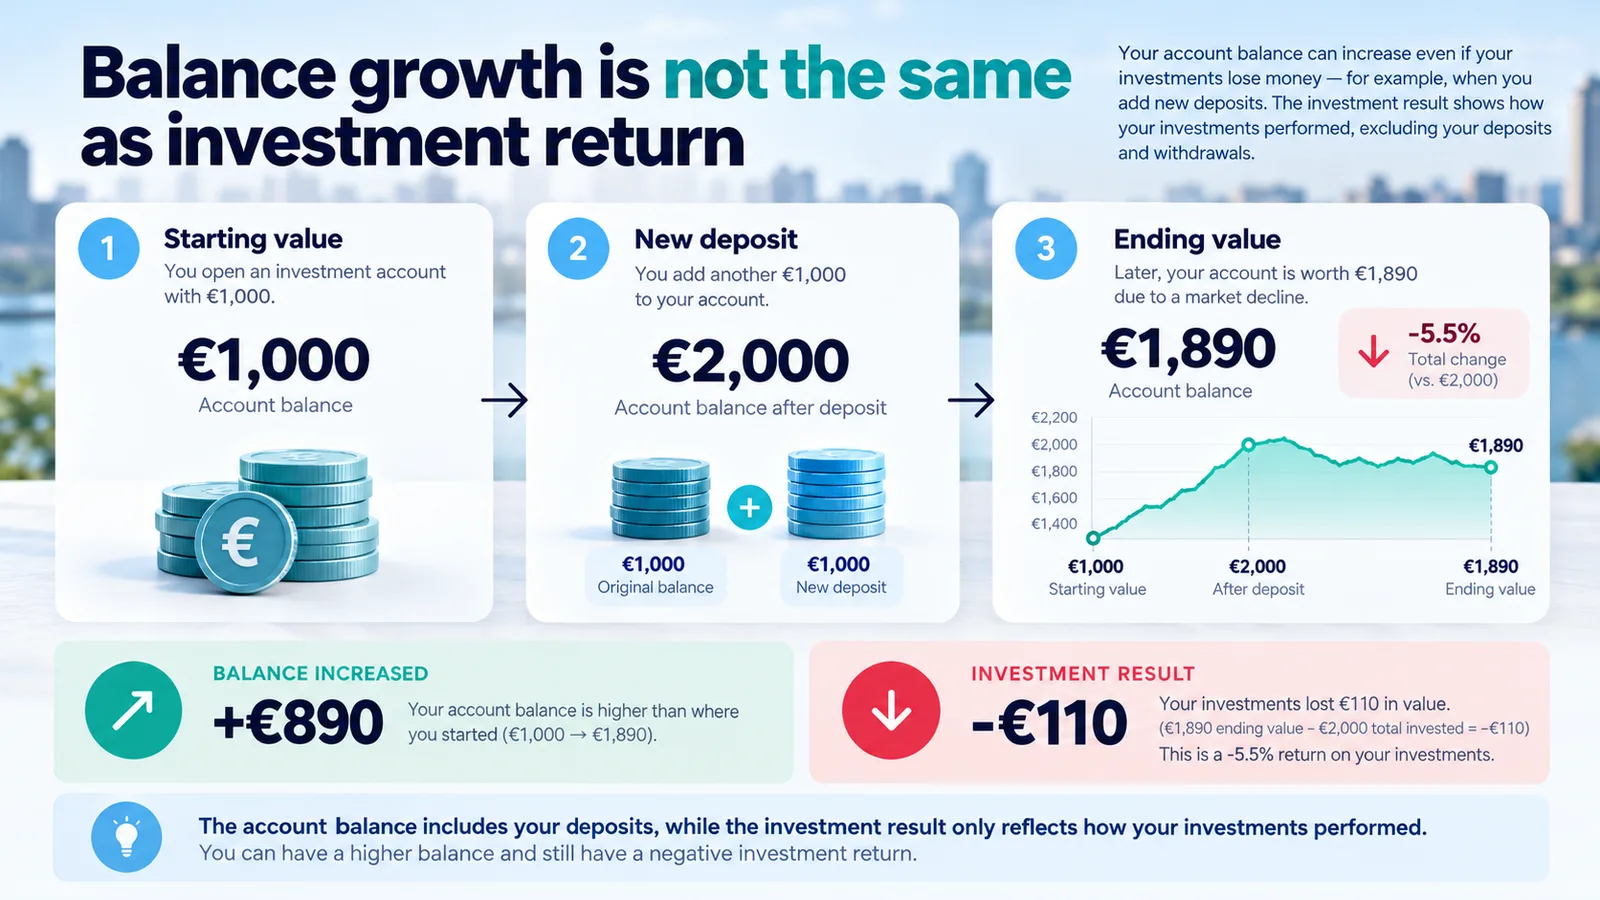
- A rising account balance is not the same as investment profit: deposits have to be accounted for.
- TWR measures portfolio performance independent of external cash-flow amounts, whereas MWR incorporates when and how much money was invested.
- A hypothetical +10% period followed by −10%, with a €1,000 midpoint contribution, gives −1% TWR, −€110 monetary P/L and approximately −7.29% annual MWR.
- Dividends, fees, taxes, inflation and currency movements can change the interpretation of a brokerage performance figure.
- Fair benchmark comparisons align time period, reporting currency, income treatment and costs.
Why your broker's +20% may be misleading
A green +20% in your investment app might refer to a single holding's price increase, unrealized profit, total portfolio return, or an annualized rate. Those are not equivalent. The number may include dividends or exclude them; reflect trading costs or ignore them; be shown in euros or dollars. Never interpret a brokerage performance figure without its period, denominator, currency and calculation method.
This guide explains the measures using reproducible examples. All numbers are hypothetical, not forecasts or personal financial advice.
First distinguish balance, profit and return
Your balance is the market value of assets plus included cash. It increases when you deposit money, even if your investments do poorly. Monetary profit measures gains after accounting for external flows. Return expresses performance as a rate, and its formula matters whenever contributions occur during the period.
Monetary profit = ending account value − beginning account value − deposits + withdrawals, assuming all transfers, including in-kind transfers of shares, are valued consistently.
Suppose you begin with €1,000, add €1,000 and finish with €1,890. Your balance increased by €890, but you actually lost €110 on investments. Dividing −€110 by the €2,000 contributed produces −5.5%, a rough profit-to-contributions ratio, not a valid annual return when the contributions were made at different times.
By contrast, begin with €5,000, deposit €2,000, withdraw €500 and finish with €7,200. Your monetary result is €7,200 − €5,000 − €2,000 + €500 = €700. This does not yet tell you how efficiently capital was invested over time.
What exactly is an external cash flow?
An external cash flow crosses the boundary of the portfolio being measured. Sending money from a bank account to your brokerage is a deposit; moving money back is a withdrawal. Transferring securities from another account can be an in-kind external flow.
Selling one ETF to buy another inside the same brokerage account is not an external cash flow for the overall account. Nor is a dividend credited to the brokerage cash balance and retained there: it is investment income generated by assets already in the account. Treating it as a fresh deposit can distort performance.
The boundary changes the answer. A trade may represent a cash flow to one individual position, while remaining internal for the entire account. State your scope before calculating any return.
Time-weighted return: how did the strategy perform?
A time-weighted return (TWR) measures a sequence of subperiod returns, split at external cash flows, and geometrically links them. It aims to remove the influence of an investor choosing when to deposit or withdraw.
TWR = (1 + r1) × (1 + r2) × ... × (1 + rn) − 1.
Accurate TWR requires portfolio valuations at the relevant flow boundaries. Approximation methods exist, but should be labeled. For example, 10% growth followed by a 10% fall gives 1.10 × 0.90 − 1 = −1%, not zero.
TWR is especially helpful when comparing an investment strategy with a benchmark, because it largely avoids giving extra weight to periods when the investor happened to have more capital invested. Industry methodologies, including the CFA Institute's GIPS standards, define conventions in more detail.
Money-weighted return: how did your money perform?
A money-weighted return (MWR), commonly calculated using internal rate of return (IRR), incorporates the amounts and timing of deposits and withdrawals. When a large deposit precedes a weak period, your MWR may be much worse than the investment's TWR; when it precedes a strong period, the opposite may happen.
Neither method is universally the one true return. TWR asks about the strategy's performance independent of investor cash-flow timing. MWR reflects the return implied by your actual investment dates and amounts.
Worked example: the same account has five different results
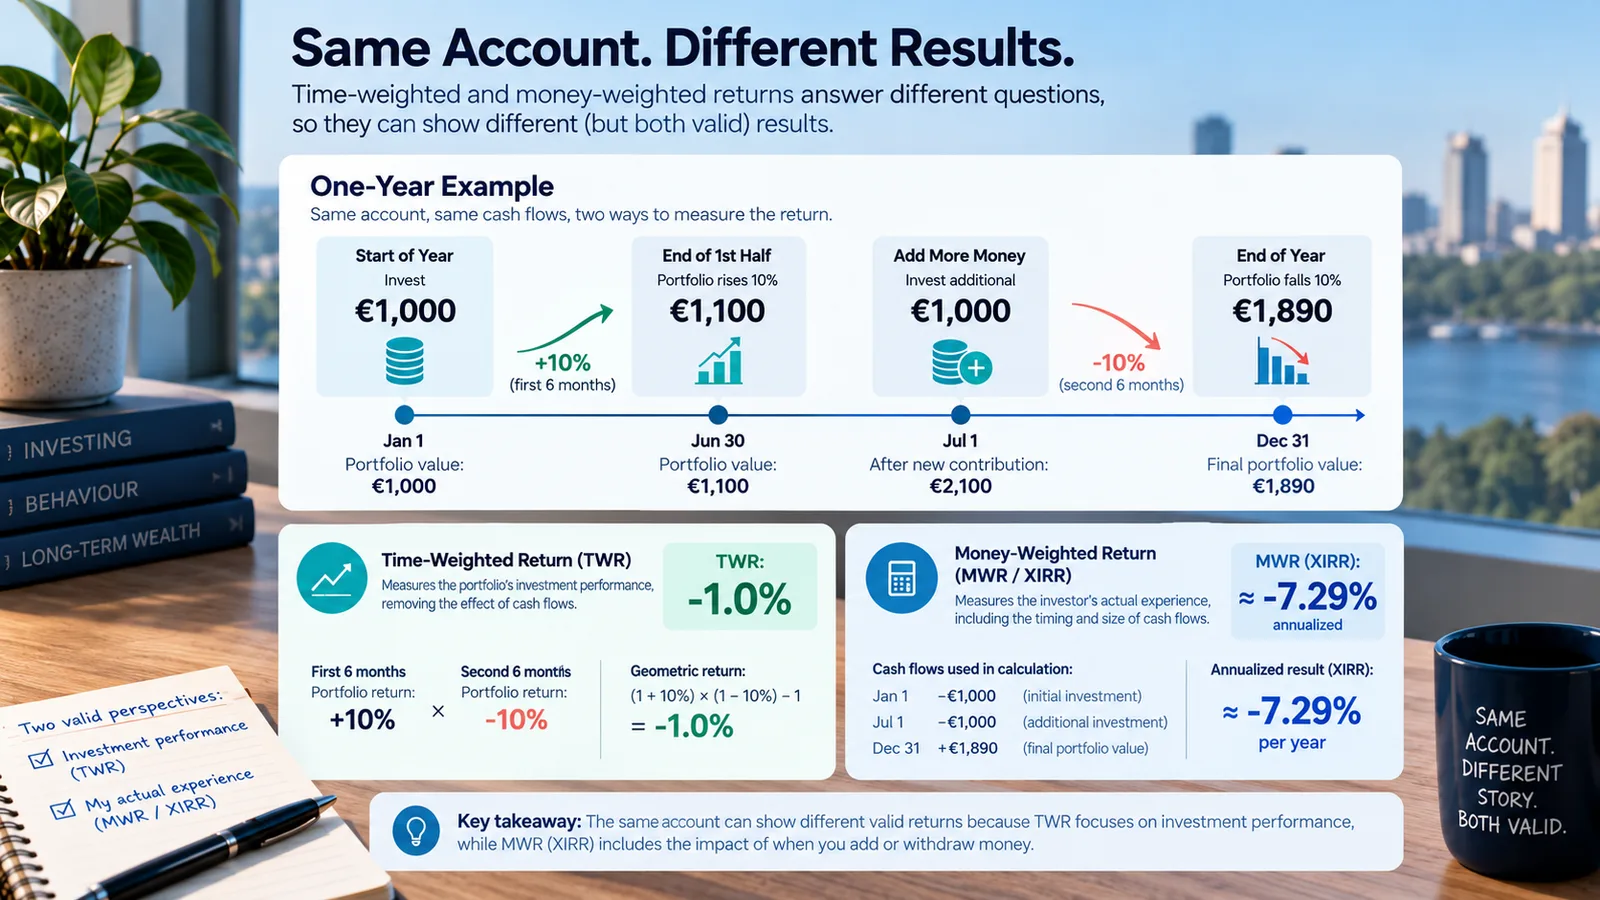
Consider a simplified one-year investment history with no fees, taxes or distributions:
| When | What happens | Portfolio value |
|---|---|---|
| Start | Invest €1,000 | €1,000 |
| Halfway | Assets rise 10% | €1,100 |
| Halfway | Add another €1,000 | €2,100 |
| End | Assets fall 10% during the second half | €1,890 |
The portfolio's TWR is 1.10 × 0.90 − 1 = −1%.
The investor's monetary profit is €1,890 − €1,000 − €1,000 = −€110.
The profit / total contributions is −€110 / €2,000 = −5.5%, but it is not an annualized investment return.
Assume the second contribution takes place exactly at the midpoint of the year. The annual effective MWR, r, satisfies €1,000 × (1 + r) + €1,000 × (1 + r)^0.5 = €1,890. Solving yields approximately −7.29% annualized.
| Metric | Result | Meaning |
|---|---|---|
| Ending value | €1,890 | Current balance |
| Monetary P/L | −€110 | Currency units lost |
| Profit / contributions | −5.5% | Simple nonannualized ratio |
| TWR | −1.00% | Portfolio path independent of deposit size |
| MWR | approximately −7.29% | Annualized rate for actual timed capital |
All five results can be simultaneously correct. The investor added capital before the loss-making period, which made the money-weighted outcome weaker.
Monthly contributions: how XIRR works
Investors who contribute monthly need to account for actual dates. XIRR is a date-aware IRR calculation available in spreadsheet software.
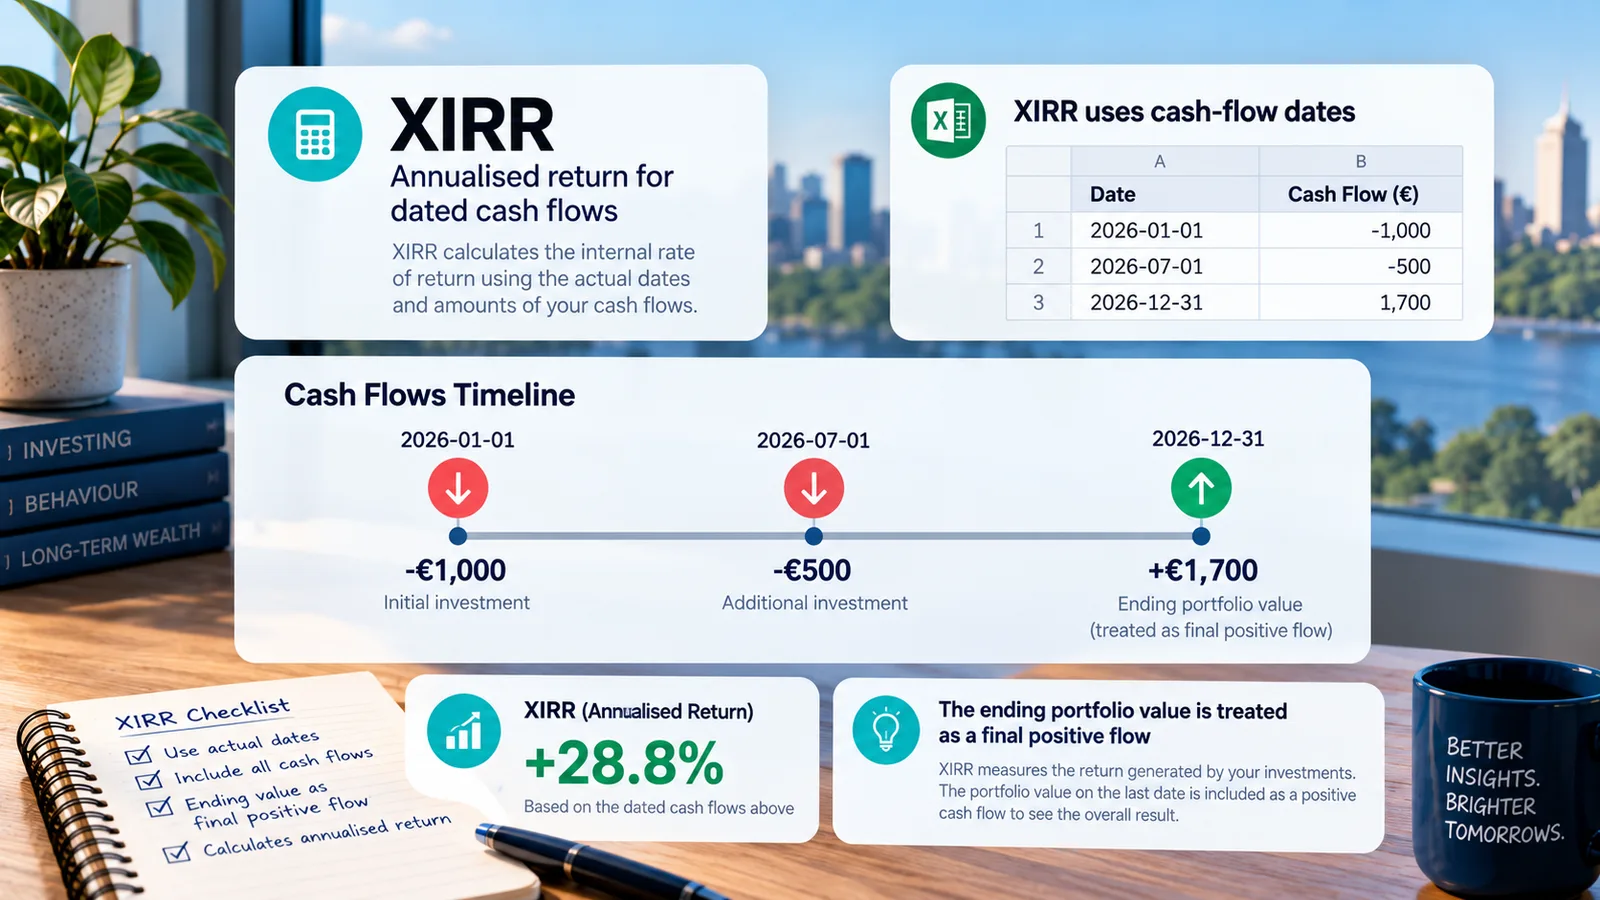
From the investor's perspective, enter deposits as negative flows, withdrawals as positive flows, and your ending portfolio market value as a hypothetical final positive flow on the valuation date. You do not need to sell your holdings; the ending value is used for measurement only.
| Date | Cash flow |
|---|---|
| 2026-01-01 | −€1,000 |
| 2026-07-01 | −€500 |
| 2026-12-31 | +€1,700 |
A spreadsheet can calculate XIRR(values, dates). The answer is an annualized rate, not simply the euro profit divided by deposits. Always check whether it is mathematically plausible: unusual sequences of positive and negative flows can have more than one IRR solution or none that is useful.
Is Modified Dietz the same as XIRR?
No. Modified Dietz approximates a flow-adjusted period return by weighting external contributions according to how long the money was invested during the measurement period. It can be useful when exact portfolio values at each contribution date are unavailable.
XIRR instead solves for a single annualized rate consistent with dated investor cash flows and the terminal value. TWR links subperiod performance. The three methods can disagree without an arithmetic error. A fair report names the method and any approximation.
Dividends change total return
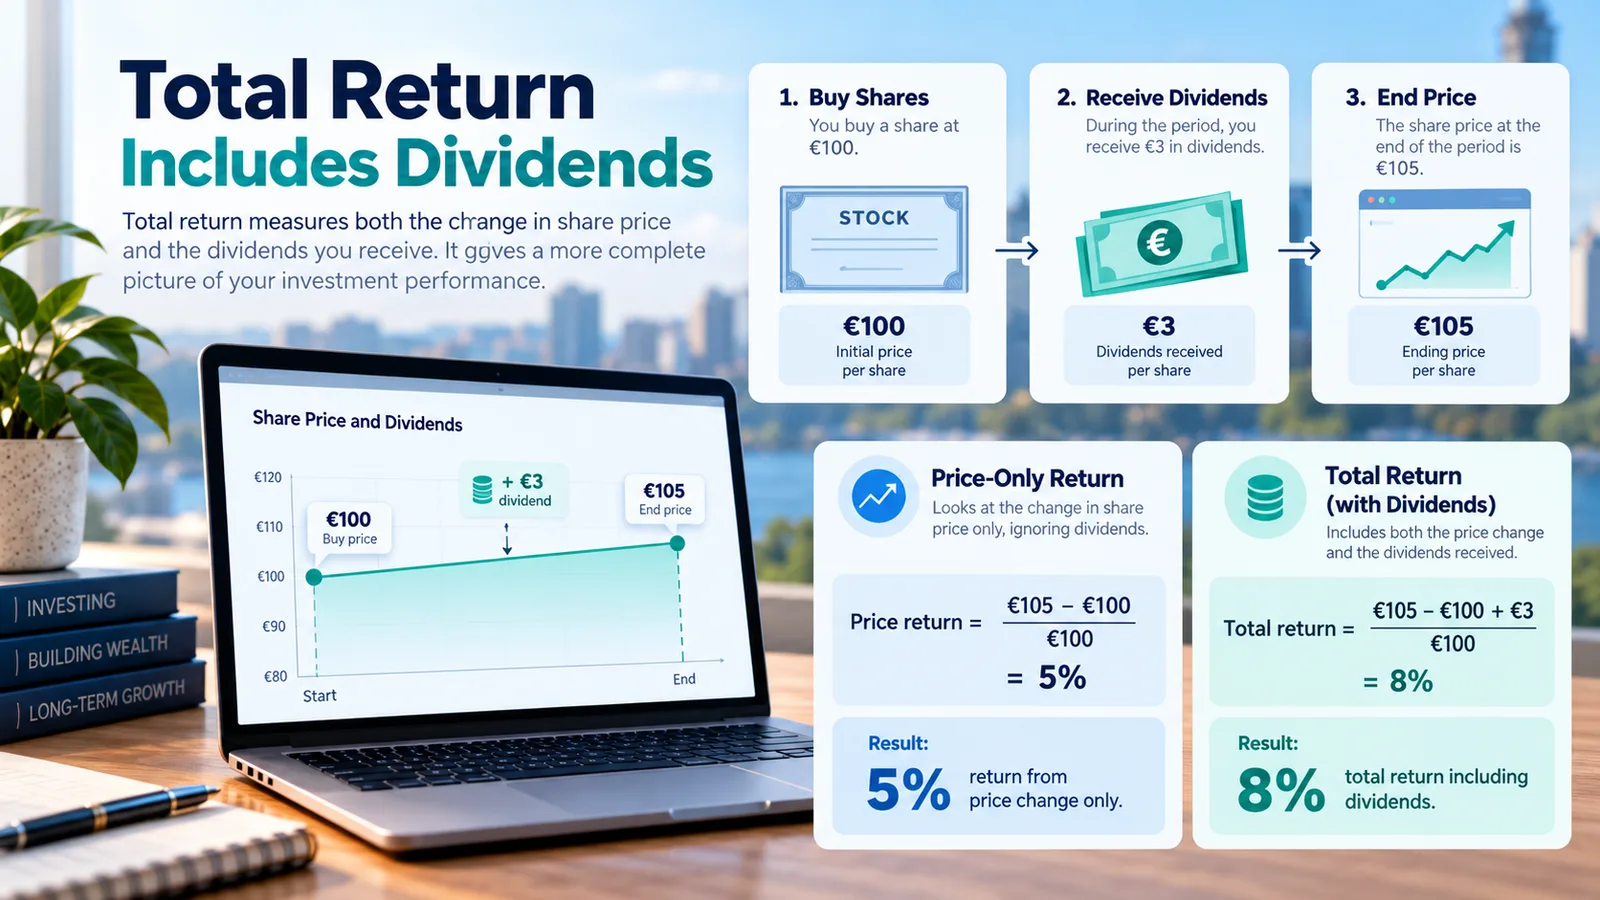
Total return includes share-price changes and cash income, under a stated reinvestment assumption. A share bought for €100, ending at €105 and paying €3 in dividends has an 8% gross holding-period return: (€105 − €100 + €3) / €100.
A price-only return would show just 5%. If a broker already reports a dividend-inclusive total return, adding the dividend again would count the income twice.
An accumulating ETF generally reinvests income internally, so its net asset value reflects that process. Do not add an imaginary separate dividend on top of its already stated return. A distributing ETF may pay investors cash, which must be handled consistently whether spent or reinvested.
For the underlying dividend mechanics, see our complete guide to dividend investing.
Realized profits, unrealized profits and cash
A stock position showing a €200 unrealized gain may be sold, turning that result into a realized gain. The open-position P/L may then disappear from the holdings screen; the economic profit has not vanished. A complete portfolio-level calculation includes open holdings, closed positions, investment income and eligible cash.
Taxable realized gains may differ from the broker's display because of acquisition-lot choices, currency rules, costs and local tax legislation. Do not automatically treat position P/L as a tax report.
Fees: gross and net returns are different
Commissions, custody or management charges, bid–ask spreads, conversion fees and fund operating expenses reduce investment outcomes. Yet a broker may include some and exclude others from its headline percentage.
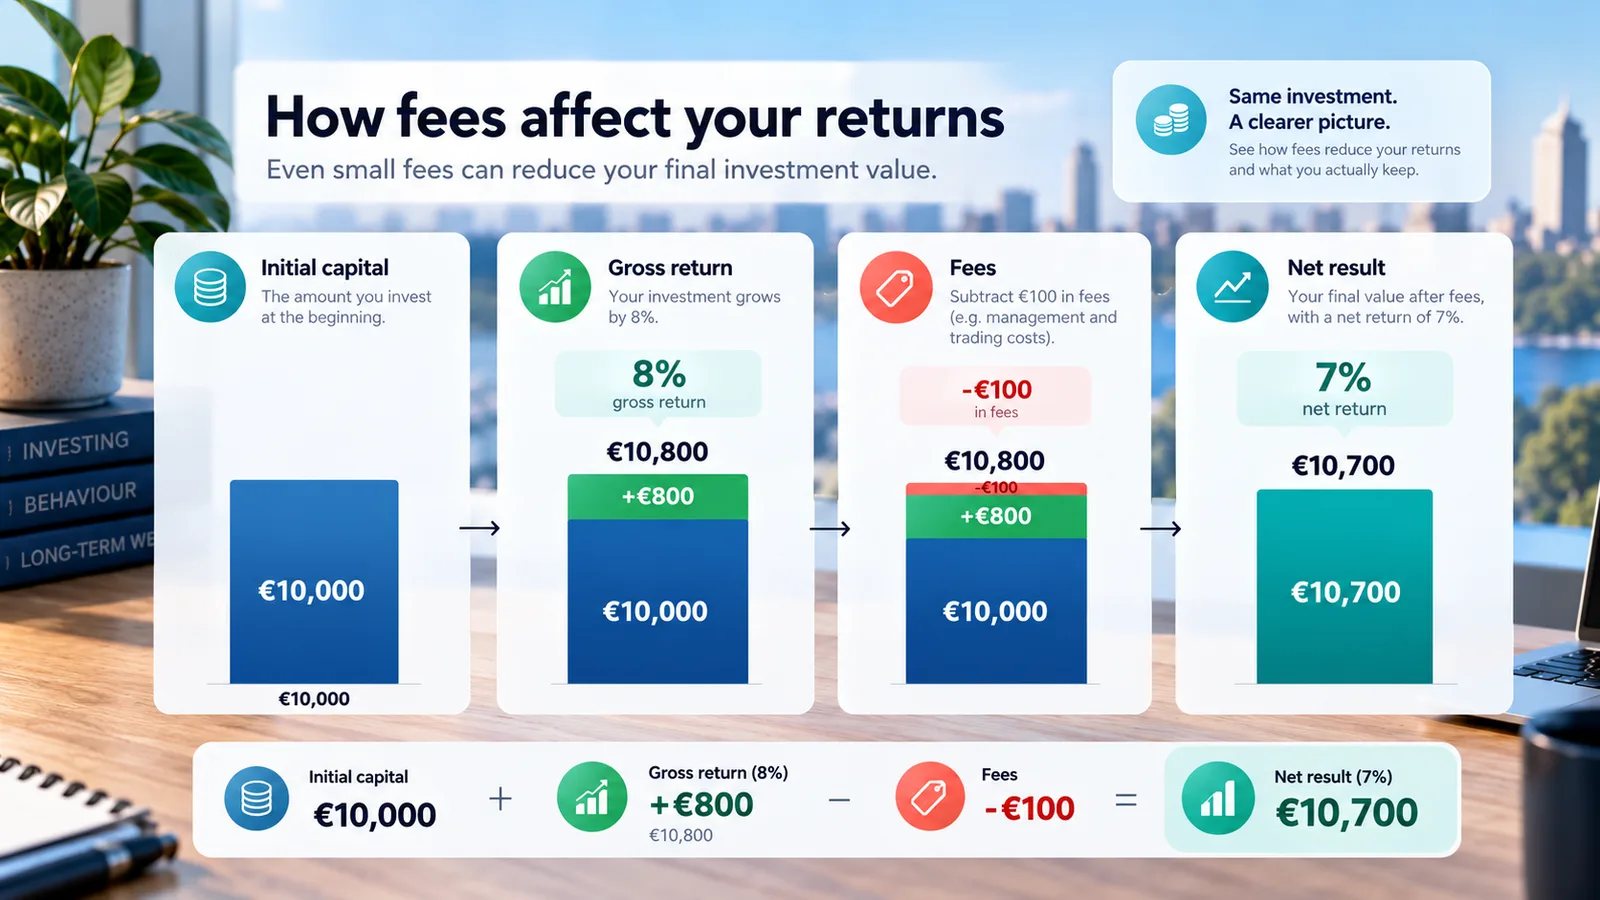
For example, if €10,000 generates an 8% gross return and then incurs a separate €100 charge, the ending value is €10,700 rather than €10,800. The net holding-period return in this simplified scenario is 7%.
An ETF's reported net asset value ordinarily already accounts for ongoing fund expenses. Your broker's dealing charges and taxes may not be included. Avoid deducting the same expense twice. The SEC's Investor.gov materials explain how recurring fees compound over long periods.
Currency can reverse your apparent gain
A European investor buys a US-listed investment for $100 when €1 = $1.00, spending €100. Later, its value rises to $110, but the exchange rate changes to €1 = $1.20.
The gain measured in dollars is +10%. The ending euro value is $110 / 1.20 ≈ €91.67, implying a euro return of approximately −8.33%, before fees and taxes.
Buying an unhedged US-focused ETF on a European exchange in euros does not automatically eliminate underlying dollar exposure. The trading currency, fund base currency, assets' economic exposure and any currency-hedging strategy are different concepts.

Inflation: did your purchasing power increase?
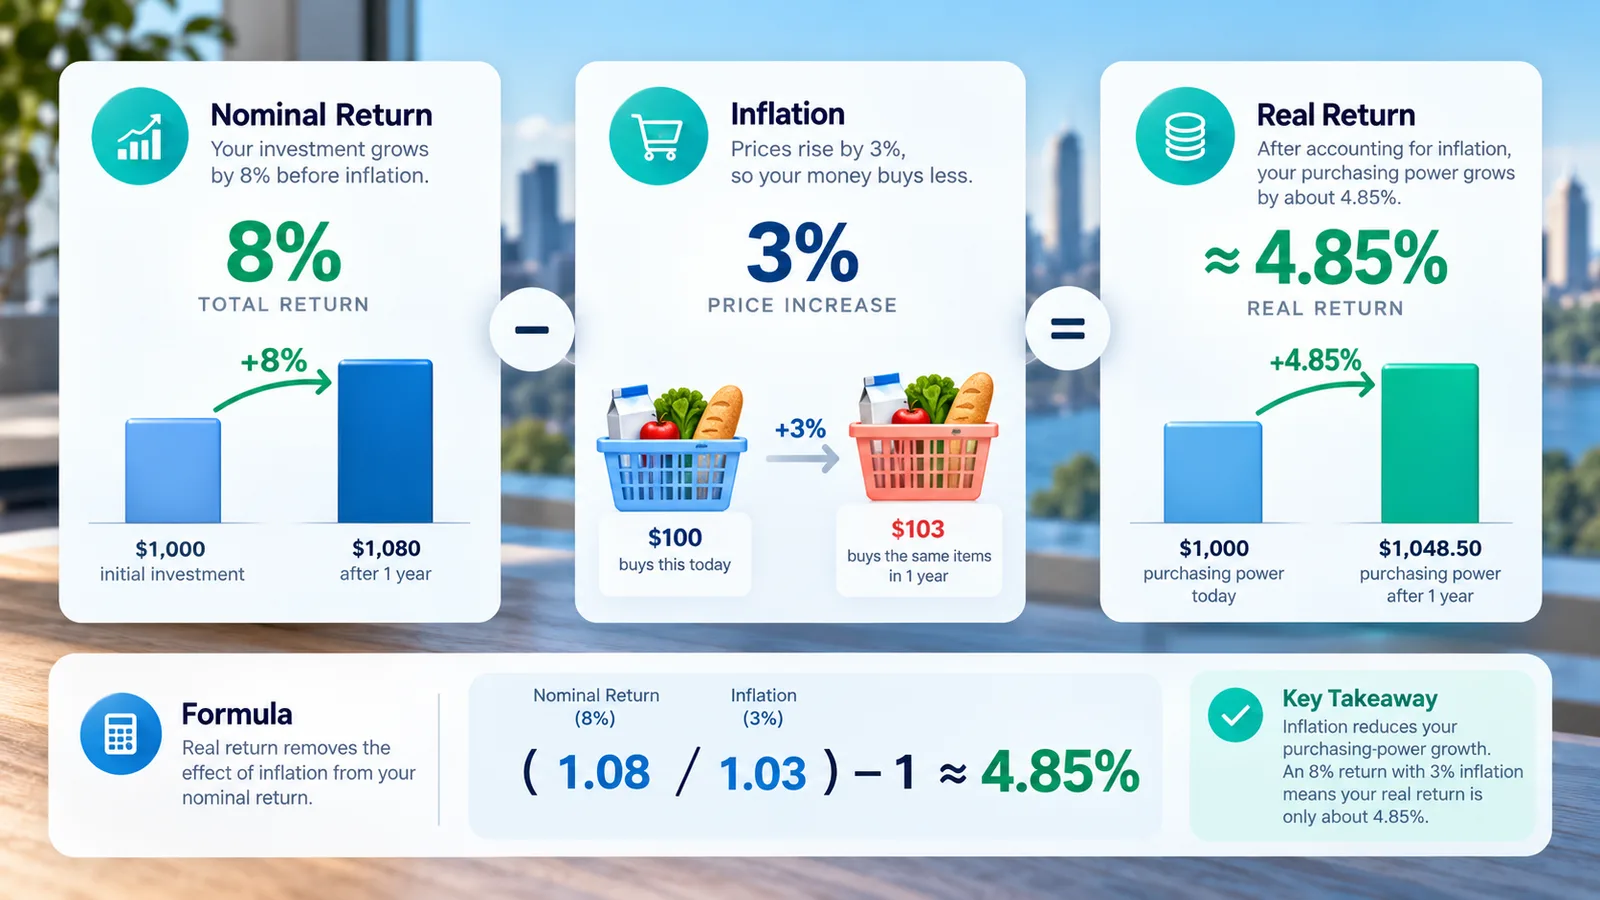
If your investments rise 8% in nominal value while prices rise 3% over the same period, the exact hypothetical real return is (1.08 / 1.03) − 1 ≈ 4.85%.
Subtracting 3 percentage points from 8% produces a useful approximation, but is not exact. Use an inflation index relevant to your spending and reporting currency. Inflation does not literally appear as a cash withdrawal from the brokerage account.
Taxes: the displayed return may be pre-tax
Dividend withholding, capital-gains tax, tax-advantaged accounts and double-taxation arrangements vary by country and personal circumstances. A broker's return may be gross of some taxes and net of others.
If withholding already reduced cash received, subtracting it again from an account-level net result could double-count the tax. If tax is paid from a separate bank account, a broker-only account report may omit that cost entirely. Verify both the accounting method and the applicable jurisdiction.
This article cannot provide a universal tax rate or replace individualized tax guidance.
Why different performance screens disagree
Common reasons include:
- Period: one month, year-to-date, calendar year or inception to date.
- Annualized versus cumulative return.
- Scope: one stock, one pie, investments only or the whole brokerage account.
- Cash-flow dates: transaction, booking and settlement dates can differ.
- Method: simple P/L, TWR, MWR or position cost basis.
- Income: dividends paid, retained or reinvested.
- Costs: included fees, excluded charges or already-expensed ETF costs.
- Tax: gross versus after-withholding amounts.
- FX: position currency versus investor reporting currency.
- Missing activity: transfers, corporate actions, closed positions or uninvested cash.
A mismatch is not proof that the brokerage is wrong. Download statements, reconstruct the inputs and ask the provider how it calculates the number.
How to compare your result with a benchmark
Match the same start and end dates, reporting currency, income treatment and cost conventions. Comparing a euro investor's annualized IRR with a US-dollar, price-only S&P 500 index figure is not a like-for-like comparison.
For investment strategy assessment, compare a properly calculated TWR with a relevant total-return benchmark. For your own money experience, examine MWR separately. Also compare risk, diversification and asset allocation: a higher short-run percentage need not signal a superior long-run approach.
A practical eight-step audit
- Select the account boundary. Include the intended holdings and cash; remove internal transfers between accounts when evaluating them together.
- Fix the dates and currency. State whether you are measuring a period or annualizing.
- Export dated transactions. Include deposits, withdrawals, transfers, trades, distributions and fees.
- Reconcile opening and closing market values, including cash.
- Calculate monetary P/L after adjusting external flows.
- Calculate XIRR using dated investor flows and the closing value if the solution is meaningful.
- Calculate TWR if flow-date valuations are available; clearly label approximations otherwise.
- Check fees, taxes, FX, dividends and benchmark methodology before drawing conclusions.
Save the input data. A reproducible spreadsheet is usually more informative than a screenshot of a green percentage.
Which measure answers your question?
| Your question | Useful measure |
|---|---|
| How much did I gain or lose? | Monetary P/L reconciled with external flows |
| How did my chosen investments perform? | Time-weighted return |
| What return did my actual deposits experience? | Money-weighted return / XIRR |
| Did dividends contribute? | Total return with explicit income treatment |
| How much did fees reduce the result? | Like-for-like gross-versus-net comparison |
| Did the currency matter? | Same-period returns in each relevant currency |
| Did my purchasing power grow? | Inflation-adjusted real return |
| What can I actually spend? | Personal after-tax outcome |
Frequently asked questions
If my broker shows +20%, have I made 20% in a year?
Only if the broker defines it as a one-year return. It may be cumulative or limited to individual holdings.
Can my balance go up while my investments lose money?
Yes. A new deposit increases cash value, not investment profit.
Which is better, time-weighted or money-weighted return?
They answer different questions. Use TWR to evaluate the investment path and MWR to reflect the experience of dated cash flows.
Are reinvested dividends counted twice?
Not in a properly constructed total-return calculation. Do not add a second dividend to a return that already includes it.
Does selling a winning stock reset my results?
Not at the overall portfolio level. It converts unrealized gains into realized outcomes.
Does a 7% annualized return mean 7% every year?
No. Annualized rates summarize compounding over the historical interval; actual annual results vary and can be negative.
Should I compare my euro account to a dollar benchmark?
Only after aligning currency, dates, distributions and fees.
Final takeaway
There is no single return percentage that fully describes a portfolio. A useful dashboard gives you the account's value, monetary profit, cash-flow-adjusted performance, and context for fees, dividends, currency, taxes and inflation. Learn the calculation before celebrating—or worrying about—the headline number.
Educational content only. Hypothetical examples are not forecasts or personal investment advice.
Sources & references
Found an error? Contact us with the source and passage to correct.